Page Focus
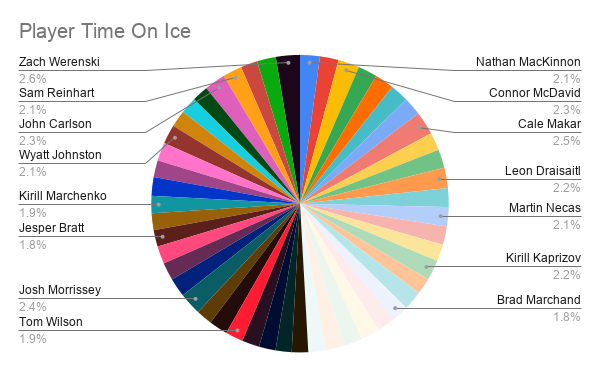
The goal of this analysis is to look at how different hockey players contribute offensively. The first chart compares total shots to total goals, the second chart compares players by points per game, and the third chart shows how ice time is distributed. Looking at all three together creates a clearer story: players who shoot a lot are not always the most efficient, players with strong points per game stand out even when they do not lead every category, and time on ice helps explain which players are trusted with the biggest roles.
Original Dataset
Below is a simplified version of the data used to build the charts. This includes the core statistics being compared.
| Name | Team | Position | Games Played | Goals | Assists | Points | +/- | PIM | Avg TOI | PP Goals | PP Assists | Shots | Shooting % | Shifts | GWG | Faceoff % |
|---|---|---|---|---|---|---|---|---|---|---|---|---|---|---|---|---|
| Nathan MacKinnon | COL | C | 22 | 17 | 20 | 37 | 23 | 12 | 21:44 | 5 | 4 | 94 | 18.1 | 511 | 2 | 48.5 |
| Macklin Celebrini | SJ | C | 23 | 14 | 20 | 34 | 5 | 12 | 20:31 | 4 | 8 | 67 | 20.9 | 496 | 3 | 48.7 |
| Connor McDavid | EDM | C | 24 | 10 | 23 | 33 | -5 | 10 | 23:20 | 3 | 10 | 72 | 13.9 | 545 | 0 | 47.8 |
| Connor Bedard | CHI | C | 22 | 13 | 18 | 31 | 9 | 22 | 21:07 | 4 | 6 | 72 | 18.1 | 514 | 2 | 50.2 |
| Jack Eichel | VGK | C | 22 | 10 | 20 | 30 | 4 | 2 | 21:02 | 0 | 12 | 91 | 11 | 511 | 2 | 49.4 |
| William Nylander | TOR | RW | 19 | 10 | 19 | 29 | 5 | 12 | 20:16 | 2 | 3 | 44 | 22.7 | 459 | 1 | 38.9 |
| David Pastrnak | BOS | RW | 24 | 11 | 18 | 29 | -7 | 14 | 20:09 | 5 | 8 | 85 | 12.9 | 496 | 2 | 100 |
| Cale Makar | COL | D | 22 | 9 | 20 | 29 | 22 | 10 | 25:35:00 | 0 | 7 | 62 | 14.5 | 591 | 3 | 0 |
| Leo Carlsson | ANA | C | 22 | 11 | 18 | 29 | 11 | 23 | 19:37 | 2 | 7 | 55 | 20 | 548 | 3 | 46.1 |
| Mark Scheifele | WPG | C | 21 | 11 | 17 | 28 | 6 | 16 | 20:18 | 3 | 3 | 49 | 22.4 | 467 | 2 | 51.3 |
| Leon Draisaitl | EDM | C | 24 | 14 | 14 | 28 | 6 | 6 | 22:29 | 7 | 5 | 59 | 23.7 | 561 | 1 | 56.9 |
| Mikko Rantanen | DAL | RW | 22 | 10 | 18 | 28 | -4 | 57 | 20:38 | 4 | 11 | 58 | 17.2 | 488 | 1 | 48.3 |
| Martin Necas | COL | C | 22 | 13 | 15 | 28 | 19 | 16 | 21:06 | 3 | 4 | 46 | 28.3 | 501 | 0 | 53.8 |
| Jason Robertson | DAL | LW | 22 | 13 | 15 | 28 | 9 | 2 | 20:21 | 4 | 7 | 96 | 13.5 | 482 | 1 | 0 |
| John Tavares | TOR | C | 22 | 12 | 15 | 27 | 3 | 6 | 18:35 | 2 | 2 | 66 | 18.2 | 473 | 1 | 60.9 |
| Kirill Kaprizov | MIN | LW | 23 | 13 | 14 | 27 | 1 | 6 | 22:10 | 6 | 4 | 78 | 16.7 | 479 | 1 | 0 |
| Cutter Gauthier | ANA | LW | 22 | 13 | 13 | 26 | 13 | 12 | 17:58 | 3 | 2 | 97 | 13.4 | 496 | 2 | 41.2 |
| Matt Boldy | MIN | LW | 23 | 13 | 12 | 25 | 3 | 12 | 21:03 | 5 | 6 | 75 | 17.3 | 478 | 2 | 39.4 |
| Brad Marchand | FLA | LW | 21 | 13 | 12 | 25 | -6 | 18 | 18:11 | 2 | 6 | 60 | 21.7 | 471 | 1 | 20 |
| Nikita Kucherov | TB | RW | 20 | 10 | 15 | 25 | 1 | 6 | 20:29 | 3 | 4 | 60 | 16.7 | 444 | 3 | 0 |
| Bo Horvat | NYI | C | 23 | 14 | 11 | 25 | 13 | 20 | 20:22 | 3 | 5 | 79 | 17.7 | 549 | 3 | 59.1 |
| Dylan Larkin | DET | C | 23 | 13 | 12 | 25 | 11 | 22 | 20:42 | 3 | 2 | 78 | 16.7 | 566 | 3 | 56.7 |
| Kyle Connor | MPG | LW | 21 | 11 | 14 | 25 | 5 | 6 | 20:34 | 1 | 5 | 76 | 14.5 | 480 | 1 | 0 |
| Troy Terry | ANA | RW | 22 | 7 | 18 | 25 | 14 | 4 | 18:54 | 0 | 6 | 53 | 13.2 | 527 | 1 | 66.7 |
| Alex DeBrincat | DET | RW | 23 | 11 | 14 | 25 | -2 | 4 | 18:00 | 6 | 3 | 88 | 12.5 | 488 | 2 | 40 |
| Evgeni Malkin | PIT | C | 21 | 6 | 18 | 24 | 4 | 14 | 17:41 | 2 | 8 | 52 | 11.5 | 429 | 0 | 45 |
| Lucas Raymond | DET | LW | 21 | 7 | 17 | 24 | 7 | 4 | 18:15 | 1 | 6 | 53 | 13.2 | 465 | 2 | 100 |
| Sidney Crosby | PIT | C | 21 | 13 | 10 | 23 | -3 | 24 | 19:09 | 6 | 2 | 46 | 28.3 | 464 | 1 | 53.5 |
| Tom Wilson | WSH | RW | 23 | 12 | 11 | 23 | 11 | 52 | 19:29 | 4 | 2 | 52 | 23.1 | 541 | 1 | 50 |
| Nick Suzuki | MTL | C | 21 | 5 | 18 | 23 | 11 | 4 | 20:27 | 3 | 6 | 44 | 11.4 | 466 | 0 | 52.3 |
| Morgan Geekie | BOS | C | 24 | 17 | 6 | 23 | -7 | 8 | 17:43 | 4 | 3 | 65 | 26.2 | 472 | 2 | 43 |
| Josh Morrissey | WPG | D | 21 | 5 | 17 | 22 | 7 | 6 | 24:32:00 | 1 | 5 | 37 | 13.5 | 604 | 0 | 0 |
| Jake Guentzel | TB | C | 22 | 12 | 10 | 22 | 4 | 6 | 20:44 | 3 | 3 | 64 | 18.8 | 512 | 2 | 53.8 |
| Nick Schmaltz | UTA | C | 23 | 10 | 12 | 22 | 0 | 4 | 19:29 | 3 | 3 | 58 | 17.2 | 536 | 2 | 38.3 |
| Brandon Hagel | TB | LW | 21 | 11 | 11 | 22 | 10 | 12 | 19:27 | 1 | 2 | 62 | 17.7 | 503 | 3 | 44.8 |
| Jesper Bratt | NJ | LW | 22 | 5 | 17 | 22 | 0 | 8 | 18:15 | 1 | 5 | 50 | 10 | 498 | 2 | 0 |
| Cole Caufield | MTL | RW | 21 | 13 | 9 | 22 | 9 | 8 | 18:28 | 1 | 5 | 59 | 22 | 440 | 3 | 40 |
| Kirill Marchenko | CBJ | RW | 22 | 8 | 14 | 22 | 8 | 8 | 18:57 | 1 | 6 | 65 | 12.3 | 471 | 2 | 0 |
| Matthew Knies | TOR | LW | 19 | 5 | 17 | 22 | 4 | 8 | 20:32 | 2 | 0 | 42 | 11.9 | 450 | 0 | 0 |
| Trevor Zegras | PHI | C | 21 | 7 | 14 | 21 | -1 | 20 | 18:29 | 2 | 6 | 50 | 14 | 454 | 0 | 37.8 |
| Tim Stutzle | OTT | C | 22 | 11 | 10 | 21 | 7 | 8 | 20:07 | 2 | 4 | 59 | 18.6 | 571 | 3 | 60.4 |
| Wyatt Johnston | DAL | C | 22 | 11 | 10 | 21 | -3 | 6 | 21:04 | 8 | 5 | 62 | 17.7 | 533 | 2 | 51 |
| Logan Cooley | UTA | C | 23 | 13 | 8 | 21 | 5 | 20 | 18:33 | 3 | 1 | 48 | 27.1 | 510 | 1 | 40.3 |
| Will Smith | SJ | C | 23 | 7 | 14 | 21 | 5 | 8 | 18:06 | 1 | 5 | 53 | 13.2 | 458 | 2 | 17.4 |
| Alex Ovechkin | WSH | LW | 23 | 10 | 11 | 21 | 7 | 4 | 17:51 | 1 | 3 | 54 | 18.5 | 468 | 3 | 100 |
| John Carlson | WSH | D | 22 | 5 | 16 | 21 | 8 | 6 | 23:10 | 0 | 5 | 50 | 10 | 524 | 0 | 0 |
| Sam Reinhart | FLA | C | 22 | 13 | 8 | 21 | -8 | 2 | 21:02 | 4 | 4 | 63 | 20.6 | 526 | 5 | 32.4 |
| Alex Tuch | BUG | RW | 22 | 8 | 13 | 21 | 3 | 33 | 18:30 | 1 | 1 | 50 | 16 | 570 | 0 | 44.4 |
| Mitch Marner | VGK | RW | 22 | 4 | 17 | 21 | 6 | 4 | 20:44 | 1 | 4 | 39 | 10.3 | 489 | 0 | 52 |
| Zach Werenski | CBJ | D | 23 | 7 | 14 | 21 | 8 | 0 | 26:26:00 | 1 | 5 | 89 | 7.9 | 609 | 0 | 0 |
Chart 1: Shot Accuracy
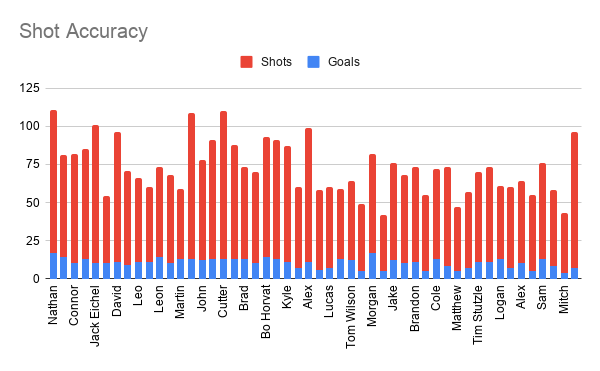
Chart 2: Player vs Points Per Game
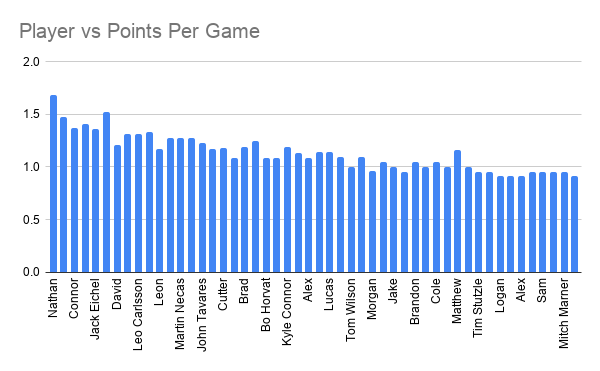
Chart 3: Player Time On Ice